- By Prateek Levi
- Sat, 07 Mar 2026 10:48 PM (IST)
- Source:JND
Astronomers have managed to reconstruct what is essentially the largest three-dimensional map of hydrogen ever made from the early universe. The map looks back roughly 9 to 11 billion years, a time astronomers like to call the universe’s “cosmic noon". That was the era when galaxies were at their busiest, forming stars at a rate far higher than what we see today.
What makes the work interesting is that it does not focus on galaxies alone. Instead, researchers looked at the faint glow of hydrogen gas that exists between galaxies. That gas is extremely difficult to detect, so most of the time it remains invisible in traditional surveys. But when enough data is collected and layered together, the pattern begins to emerge.
ALSO READ: Could GTA 6 Launch Break The Internet? As Launch Day Nears, The Gaming Industry Braces For Impact
The dataset used for this project comes from the Hobby Eberly Telescope Dark Energy Experiment, or HETDEX. The telescope, located in Texas, scans the sky using instruments that break incoming light into spectra. Over time, the project has built an enormous archive of observations.
Seeing The Universe As A “Sea Of Light”
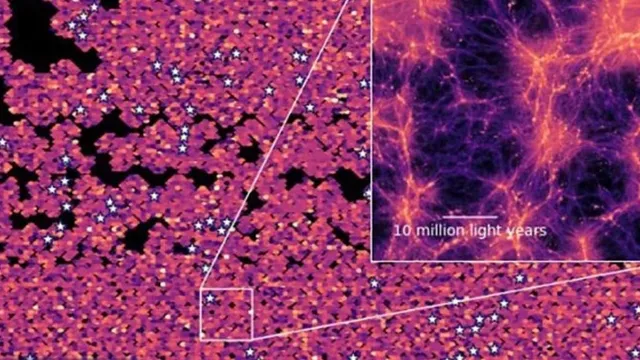
For this study, scientists used more than 600 million spectra collected by HETDEX. Rather than isolating individual galaxies, the team used a method called line intensity mapping. In simple terms, the technique measures the total glow of hydrogen across large sections of the sky.
When that information is combined, it produces something like a three-dimensional heat map of hydrogen gas. What appears is not just scattered galaxies but a much broader structure of matter stretching across the universe.
Earlier surveys often concentrated on bright galaxies because they are easier to detect. The downside is that they leave out a lot of the faint material that actually connects those galaxies together. Intensity mapping fills in that missing picture by capturing the faint Lyman alpha glow produced by hydrogen.
Why Hydrogen Matters For Galaxy Formation
Hydrogen may seem simple, but it is the basic fuel for star formation. Where hydrogen gathers, stars eventually form. That is why mapping its distribution during the universe’s most active star-forming period is so useful for astronomers.
The new map helps researchers understand how galaxies pulled in gas, formed stars, and eventually merged into larger structures over time. It also provides a way to study how the large-scale structure of the universe developed during one of its most dynamic phases.
Caryl Gronwall, a co-author of the study, explained the significance of the work, saying, "This study is an exciting first step in using intensity mapping to understand the processes involved in how galaxies form and evolve."
A Different Way Of Studying The Cosmos
The project also signals a shift in how astronomers might study the universe going forward. Instead of looking only at the brightest objects, intensity mapping allows scientists to capture the full glow of matter spread across space.
ALSO READ: Anthropic Study Reveals Which Jobs Could Be Most Exposed To AI
That broader view could help reveal structures that have remained hidden until now. As future surveys expand this technique, astronomers expect to build even more detailed maps showing how the universe’s enormous cosmic web took shape over billions of years.